
It doesn’t take long into a conversation with someone or listening to a panel composed of the same Enneagram type to realize that there are notable differences even within the same type.
There have arisen many theories to explain these differences. Individuals might favor different wings or neighboring styles. They might be at different levels of psychological maturity and health (from psychotic to neurotic to manipulative to healthy.) They might be in a happy place (balanced or relaxed point) or in a distressed place (stress point). They might favor certain instincts over others (sexual, social, self-preservation.) They might prefer certain centers over others (head, heart, gut.) Or human beings may simply be perverse and refuse to fall into any neat categories.
Jerry Wagner, named an Honorary International Enneagram Association Founder, has studied, researched, written about, and taught the Enneagram for over 50 years. He has a dissertation, two books, an assessment, a training program, over 400 workshops, and innumerable undergraduate and graduate courses where he’s taught the Enneagram. Partridges and pear trees are in process.
Jay Magidson, founder of Statistical Innovations, is widely published in statistics, has edited two classic texts on latent variable modeling, and is passionate about latent class (LC) modeling. He has conducted statistical modeling workshops for over 40 years, and among his many consulting projects, he used LC to assist the Myers Briggs Company in scoring the most recent version of the MBTI, and taking a closer look at subsets which reveal underlying facets of each of the four MBTI Jungian type dichotomies.
More recently, Dr. Magidson (2023) used LC to deep dive into the item responses from more than 160,000 anonymous subjects who have taken the Wagner Enneagram Personality Style Scales (WEPSS) over the years. The WEPSS report shows the percentile scores from highest to lowest of all nine Enneagram styles. The idea is that LC can be used to analyze the many ways that persons with the same core style differ in their ranking across all styles, and reveal meaningful subsets for these individuals if such exist.
Latent Class Analysis (LC) is a statistical procedure that can find meaningful classes (groups) that underly Enneagram item responses (observed data). The resulting classes are not directly observed but are rather inferred, through a mathematical model, from the observed data.
So, can a statistical examination of data confirm, refute, clarify, obfuscate or offer even different but meaningful groupings or subsets underlying the Enneagram’s types?
There is a saying among statisticians that if you torture the data enough, it will confess to whatever you want it to say. That is why it is important to use LC which is justified on sound statistical grounds to synthesize the vast number of potential subsets (362,880 to be exact) to obtain a few most meaningful latent class clusters. Persons can be distinguished from each other according to their ranking across the entire spectrum of all 9 styles. In total there are 9 factorial = 362,880 potential subsets. An impressive but not necessarily helpful number. We’ll see if LC can get that down to manageable clusters.
We are happy to report that no data was harmed in this process. Jay did not torture or tease the data. He didn’t say: “Mirror, mirror on the wall who is the fairest of them all?” He simply said: “Mirror, mirror on the wall, what do you see?” So, he let the data speak for itself with no prior assumptions or hypotheses.
Here is what the data said.
The incidence of the types turns out to be fairly even based on Jay’s analysis of percentile scores. Despite some theories suggesting a preponderance of one type over the others, statistics based on this large sample indicate that the Enneagram types tend to be more or less uniformly distributed. So, Mother Nature doesn’t favor one type over another. Maybe cultures do?
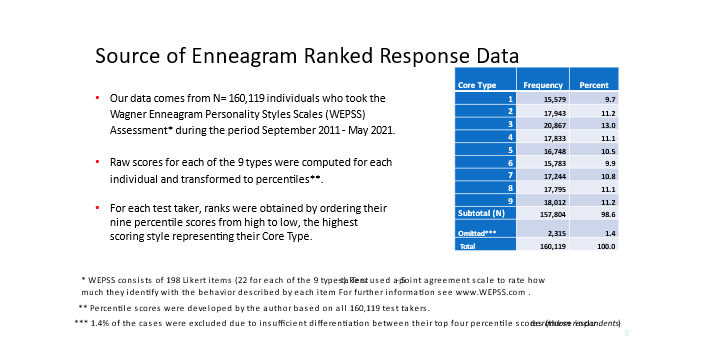
The above slide is reproduced from Magidson, Jay (2023) “Using Latent Class Models to Derive Subsets for the Enneagram Personality Typology”, presented at the 2023 Modern Modeling Methods Conference, University of Connecticut.
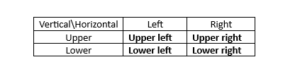
Two Axes and Four Quadrants
In the following tables we show the distribution of the Enneatypes and explain how their graphical arrangement within the Enneagram square was derived. After removing 1.5% of the test takers who showed no clear preferences among the 9 types, the LC analysis on the remaining 157,804 subjects showed that a subset of four latent classes provided a good fit to the data.
Specifically, the four classes are structured into vertical and horizontal dimensions, falling into quadrants formed by these two dichotomous factors.
Individuals vary in their positioning on the Enneagram square according to which of the possible 362,880 rankings they fall into.
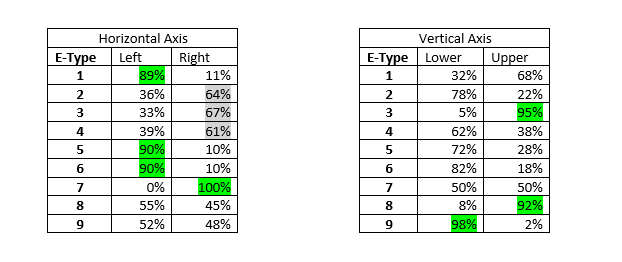
The first table above shows that the Horizontal factor distinguishes persons who identify most with Enneatype One, Five or Six from those who identify most with Enneatype Seven (and to a lesser extent the heart types Twos, Threes and Fours). Below, we use labels such as “controlled” vs. “free-spirit” to flesh out the meaning of this latent dimension.
The second table above shows that the Vertical factor distinguishes persons who identify most with Enneatype Nine from those who identify most with Threes and Eights. We use labels “receptive” vs. “assertive” to distinguish those positioned in the lower vs. the upper part of the graphical display. In particular, we see that 98% of those identifying most with Nines are plotted in the lower part of the graph while 95% and 92% of E-3s and E-8s appear in the upper part of the 2-dimensional display.
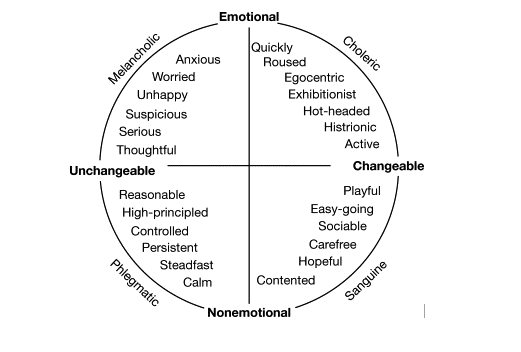
In summary, the vertical dimension shows a major difference between Eights and Nines. Overall, 92% of the Eights tend to be in the upper area, while 98% of the nines tend to be in the lower part. In contrast, the horizontal dimension highlights the difference between Ones, Fives and Sixes who tend to be on the left and Sevens on the right. Interestingly enough, this maps neatly into how two early German psychologists, I. Kant and W. Wundt, arranged the ancient theory of temperaments. The trait theorist Hans Eysenck later elaborated on their plotting.
Kant and Wundt labeled their horizontal dimension unchangeable vs. changeable. This parallels the horizontal dimension captured by LC, where Ones, Fives and Sixes may be thought of in some respects as unchangeable (more structured? constant?) and Sevens represent the changeable (less structured? variable?) style.
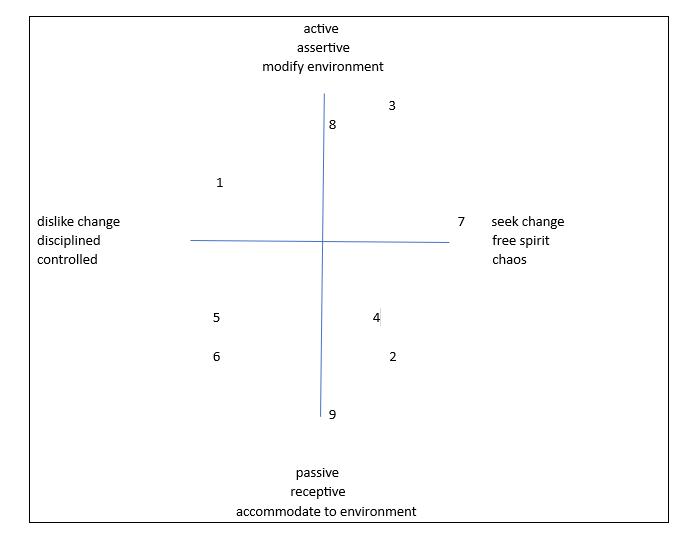
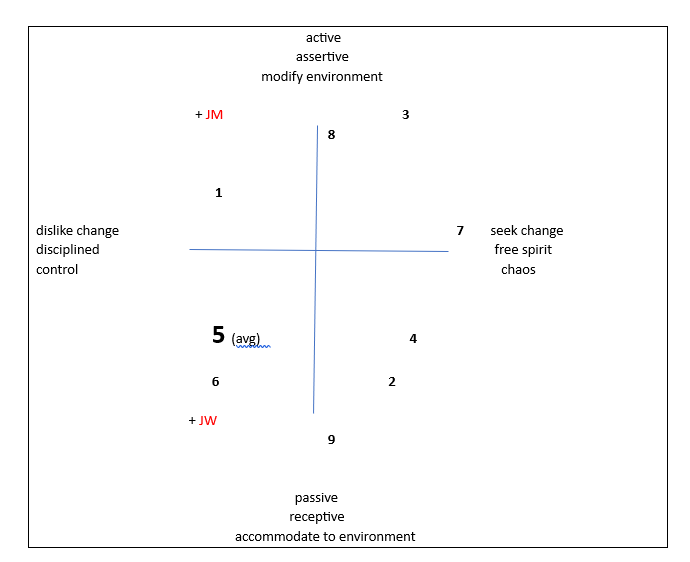
We provide additional labeling of the horizontal dimensions in the diagram above: disciplined vs. free-spirit; control vs. chaos. Readers might come up with different descriptors.
Vertically, Kant and Wundt called their dimension emotional vs. non-emotional. Here, LC captures a somewhat different personality dimension, which we label assertive vs. receptive. At the top Eights tend to be assertive vs. Nines who are more receptive. We added additional descriptors for this vertical dimension: active vs. passive; modify environment vs. accommodate to environment.
Notice that the placement revealed by LC is quite different than that provided by the Enneagram circle where Eights and Nines appear next to each other near the top of the circle. How can these differences be explained?
Jay’s explanation for the difference is that the Enneagram circular positioning reflects conceptual distance with Eights and Nines appearing near each other because they are both body types. In contrast, distance in the LC mapping represents similarity with respect to the two extracted behavioral personality dimensions. In this sense, the square maps the Enneagram points according to concrete behavior while the Enneagram circle is more conceptual in nature. While the Enneagram circle maps 8s near 9s at the top, LC analysis finds that behaviorally, 8s and 9s differ more than any other type pair.
For example, notice that Ones and Sixes both are mapped on the left side of the horizontal dimension corresponding to controlled styles. While their behavior may be quite similar, their motivations for behaving in a controlled manner couldn’t be more different. Sixes avoid taking certain actions because of fear of what the consequences of that action might be while Ones restrict their actions to those that are “right” and avoid taking those that are “wrong”. In that sense, Ones and Sixes are behaviorally similar, and may respond similarly to behavioral questions on an Enneagram test.
The LC analysis was designed to extract the most meaningful dichotomous (either-or) factors that underlie the WEPSS data. The more widely known latent variable technique called Factor Analysis extracts continuous factors. The latent class mapping positions Enneatypes within a square, which references the title of this article.
To summarize:
Eights and Nines lie on the continuum between active/assertive/modify environment and passive/receptive/accommodate to environment. While One’s and Sevens lie on the continuum between disliking-liking change, disciplined-free spirit, control-chaos.
Threes tend to fall into the upper right quadrant; Fours and Twos into the lower right quadrant; Fives and Sixes into the lower left quadrant; and Ones leaned towards the upper left.
- Eights at the top
- Nines at the bottom
- Ones on the left
- Sevens on the right
- Threes upper right
- Fours and Twos lower right
- Fives and Sixes lower left
Squaring the Circle

Which finally brings us to the title of this article: is it possible to fit the Enneagram circle into a square?
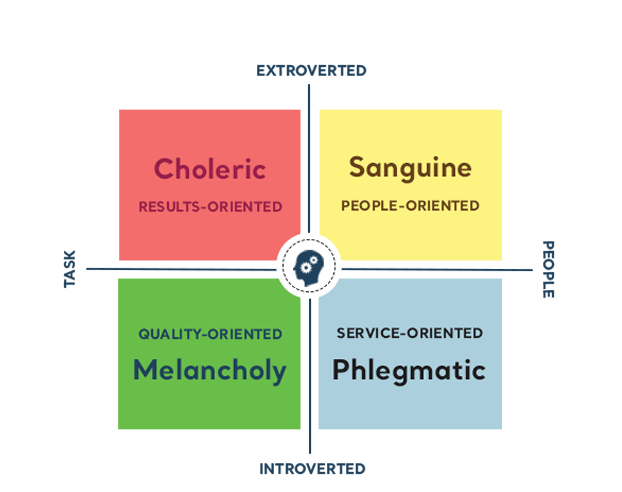
The Enneagram is a circumplex personality model that arranges nine personality styles around a circle. Circumplex models are very popular ways to lay out data. For example, temperaments:
Squares are also congenial figures for arranging information. For example, temperaments again:
Greek philosophers and mathematicians tortured themselves by trying to construct a square equal in area to a given circle using only a compass and a straightedge ruler.
Unfortunately using Euclidean geometry, this can’t be done with only a compass and a straightedge ruler. It took the brightest mathematicians over 100 years before they were able to prove that it is impossible to accomplish this task using these tools.
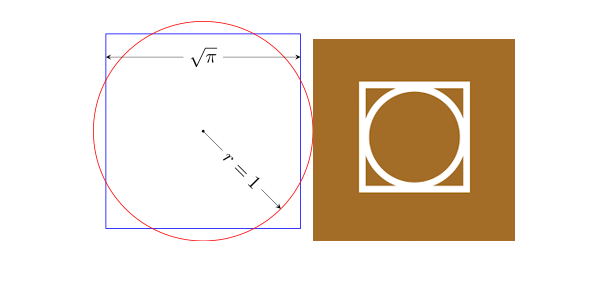
However, a little algebra solves the problem. Let X = length of side of the square, and r = radius of the circle. Thus, the area of the square = X2 and the area of the circle = πr2. Simple algebra yields X = r √π
Now, aren’t you sorry you didn’t pay more attention to those classes in high school?
When you say that someone squares the circle, you mean that they bring together two things which are normally thought to be so different that they cannot exist together.
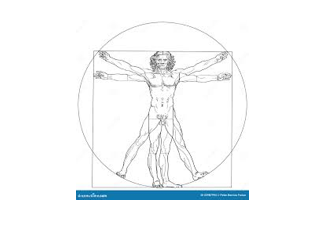
Incidentally, here is Leonardo da Vinci’s Vitruvian Man, where he attempted to portray the ideal proportions of the human form within a square in a circle:
Let us go back to the results of this latent class analysis, plotted in a square. What can they tell us about subsets of Enneagram types traditionally arranged around a circle. And how can this information be useful?
Both Jay and Jerry identify with Style Five as their core style. But they are quite different when it comes to their rankings of how they identify with the remaining eight styles. For Jay, the next highest percentiles are Eight, Four, Three, and One with lower percentiles for Two, Six and Nine. While for Jerry, the next highest rankings are Nine and Six with the lowest ranking for Eight, Three, One and Four. So, while both identify with Style Five, their percentile ranks for the remaining styles are almost opposite.
As Jay observed, even their initials JM and JW reflect this. The first letter is the same (like, type Five); the second letter is the polar opposite of the other: M is an upside-down W and W is an upside-down M (like, their ranks of all the rest of the types). Could Freud be right that there are no accidents?
Here are their rankings from highest to lowest with the space between the types representing relative distances between the percentiles. When analyzing your type profile, it’s helpful to visualize the relative distance between the types.
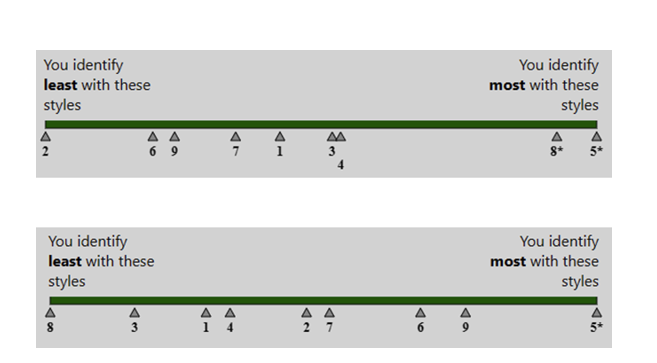
Technical Note: The asterisk * reflects statistical significance. For JW, his identification with Five is significantly higher than the other styles, as denoted by *. JM identifies with Five, but his identification with style Eight is not far behind as both are flagged *, namely as significantly higher than the other styles but not significantly different from each other.
[For related details see Magidson, J. (1998) “Using New General Ordinal Logit Displays to Visualize the Effects in Categorical Outcome Data”, chapter 34 in Blasius and Greenacre (Eds), Visualization of Categorical Data, San Diego: Academic Press.]
Jay refers to his LC modeling approach as “The Enneagraph® method for mapping Enneagram personalities based on the order (ranking) of one’s identifications across the entire Enneagram spectrum”. It provides much more information about one’s personality across the full Enneagram spectrum than simply knowing one’s core type.
In the realm of research, when the variable being predicted is continuous (height/weight), the symbol R-squared (R2) is used to express the percent of quantitative variance that is explained by predictor variables (e.g., the WEPSS assessment items). When the variable being predicted is categorical (e.g.,nine types), quantitative variance does not exist, and so a measure called entropy is often used to assess the percent of qualitative variance explained by predictors.
One’s core style (a single component of one’s total Enneagram personality) accounts for only 53% of the information contained in one’s full ranking across the entire Enneagram spectrum, as calculated by the entropy R2 statistic. (By definition, entropy is at 100% when one’s full ranking across all nine types is taken into account.) Entropy R2 increases to 73% when one’s second highest type is included; 85% when one’s top 3 types are used; 90% if one’s lowest scoring type is also included with the top 3 types; and 94% if one’s top 3 types and 2 lowest scoring types are used.
By taking into account an individual’s full ranking across all nine types, you can plot where they fall within the square with much more accuracy (100% vs. 53%) than using their core style alone. For example, here is where Jay (JM) and Jerry (JW) are positioned within the quadrants based on their full rankings. Though both identify with Style Five, Jay is in the upper left quadrant while Jerry is in the lower left quadrant. This is in in stark contrast to both Jay and Jerry sharing the same position in the square based on their core Five style alone (5) which is the average of all the 5s in the sample.
Where do other core Fives fall? The square below shows where all 16,748 Fives in the sample are positioned within the square based on their top two types. As indicated above, this positioning is much more accurate than based on their core type alone (73% vs. 53% accuracy), but not as accurate as when based on their full ranking.
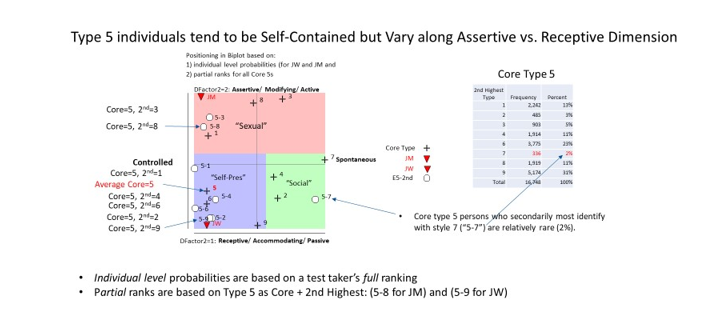
For example, we see that 98% of Fives, like Jay and Jerry, are Self-Contained Fives and appear in either the lower left or upper left quadrant -- varying only along the Vertical Axis (Assertive vs. Receptive). The only exception is Fives whose 2nd highest ranking is Seven (labeled 5-7), who appear in the lower right quadrant. This subset of Fives is quite rare – only 2% of fives exhibit the 5-7 pattern.
Interestingly, Jerry’s positioning based on his full ranking (JW) is quite near the position based on his top 2 scores alone (5-9) while Jay is positioned even higher in the square based on his full ranking (JM) than based on his top 2 scores (5-8) alone.
A limitation of objective data is they don’t tell you what they mean. Statistics can tell you how many factors account for the data, but they don’t tell you what the factors represent. So, we need theories to explain the data. That’s the subjective part.
What are some possibilities about what the data might mean now that it has spoken?
The results suggest what direction you favor: up-active/down-passive; left-unchangeable/right-changeable. Here comes an interpretation.
Are you:
- (Upper Right) Actively seeking change? Make it happen.
- (Lower Right) Allowing change to occur? Let it happen.
- (Lower Left) Passively avoiding change? Change only if circumstances require it.
- (Upper Left) Actively resisting change? I’ll change if it’s right or I’ll change if I want to.
In other words, are you:
- An active change agent, proactively bringing about new things, modifying your environment. (UR)
- Open to new things, receptive to outer and inner influences, accommodating to your environment. (LR)
- Procrastinating trying new things by exercising passive/aggressive control. (LL)
- Resisting new things by actively controlling. (UL)
Here is an additional observation or obfuscation. The arrangement of the types in these quadrants don’t fit traditional Enneagram placement around the circle. For example, at the top in the gut center, Eights and Ones are approximately in the same neighborhood but the Nines are way across town down below. Well, you say, Nines, Threes, and Sixes – in the middle of their respective centers – seem different from their neighboring wings. All right, let’s see if this works on the right for Twos, Threes, and Fours in the heart center and then on the left with Fives, Sixes, and Sevens in the head center.
Twos and Fours are in the same lower right quadrant and Threes are in the upper right quadrant. So, Threes don’t quite fit. The theory works so far. What about the head center? Sixes should be somewhat distant from Fives and Sevens. Bummer. Sixes are close to Fives in the lower left quadrant while Sevens are the outliers over in the upper right quadrant – quite far away from their fellow head-preferring neighbors. Does that mean Sixes are more likely to have Five wings vs. Seven wings? That doesn’t seem to be the case. So much for that hypothesis.
Which leads us to another aspect of research: it tends to confound or disconfirm elegant theories. These are the numbers. Maybe we need a more comprehensive Enneagram theory or an auxiliary theory to account for these data.
According to the 18th century British statistician George Box: “All models are wrong, but some are useful.” The 20th century philosopher of science Karl Popper commented that the highest praise you can give a theory is it is not yet disconfirmed. Surely, Popper would have exempted the Enneagram while Box would’ve found it useful.
Perhaps readers might have their own plausible rival hypotheses about what these combinations are all about. The authors welcome any comments and suggestions. Send your comments to jeromewagnerphd@gmail.com and we will collate them in a future article.
And for those of you who might want more technical details or to see how the other core types with their respective rankings spread out across the square (as we demonstrated with the Fives), visit Enneagraph.com or email your questions to Jay at Jay@enneagraph.com .
Our next article lays out an alternate latent class analysis of the data, unveiling three subsets underlying the Enneagram styles. So, a triangle, within a square, within a circle. Do these three latent classes relate to the three centers? Three instincts? Three subtypes? Three trends of Karen Horney? Three coins in the fountain? Stay tuned.
A third article in this series compares the nine Enneatypes with the eight types proposed by Theodore Millon, a recognized personality theorist. The results of this current study support the convergence of these two theories.
